R bootcamp
(A few remarks and tips before the practical session)
R is the best technology for doing computational science
R has an incredible wealth of toolkits
The most famous is the tidyverse ecosystem for data science:
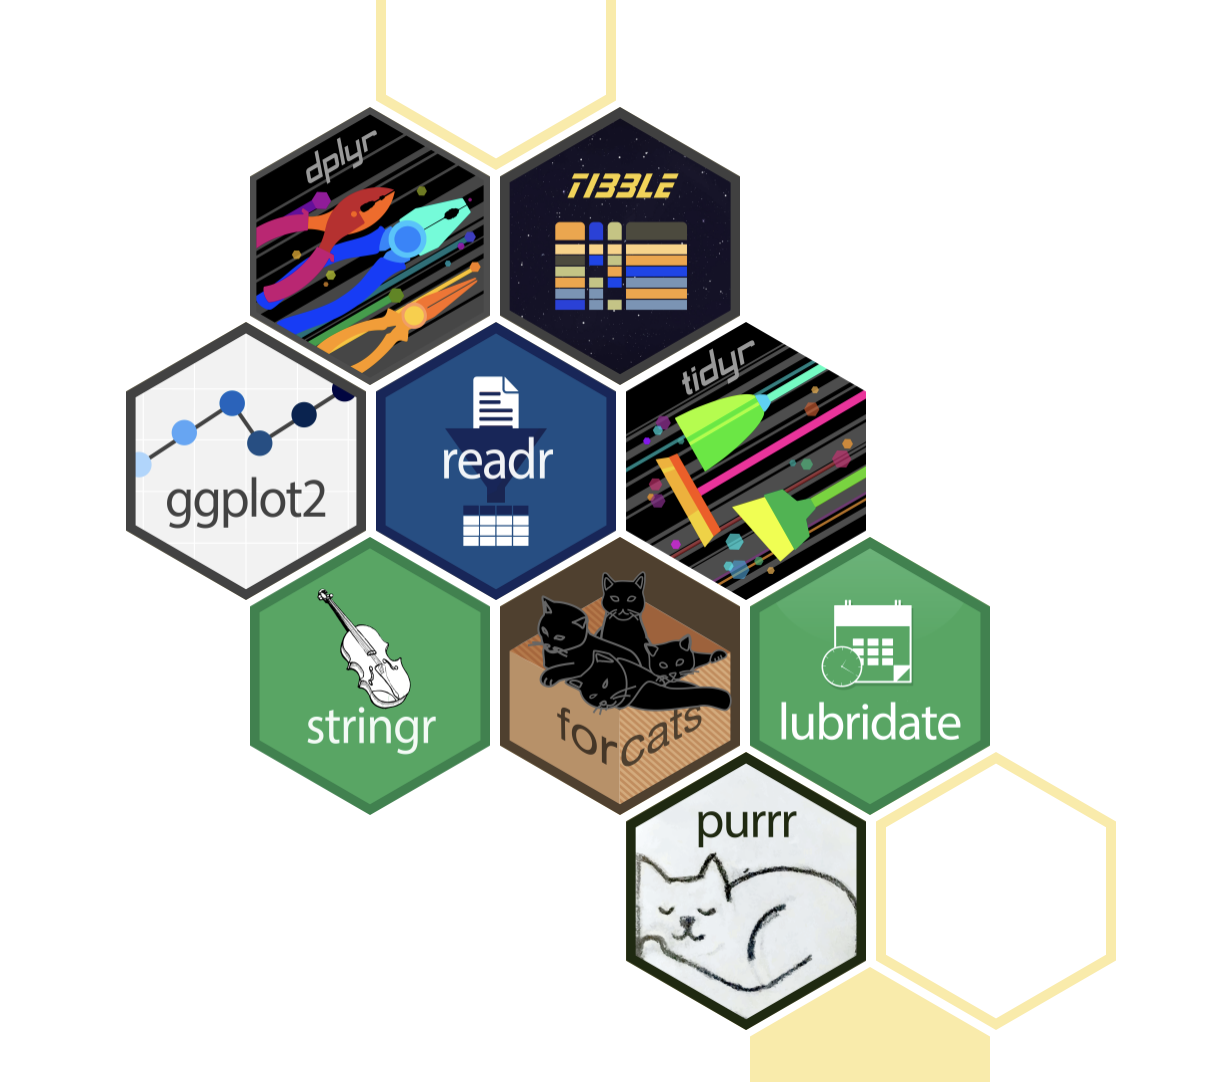
There are packages for machine learning (Keras, Tensorflow), spatial packages (sf, stars), packages specific to research fields (genomics, ecology, etc.). More than 23000 packages total.
R has awesome easy-to-use(!) tools for reproducibility
Quarto “authoring system” for writing automated reports, slides, PDF documents, etc. (our “Topic #4!”)
targets pipelining framework (possibly the most powerful and flexible of its kind)
tidyverse framework (particularly the dplyr R package introduced as “Topic 2/3”) is designed to facilitate building readable, easy-to-write processing pipelines
R itself is a very powerful, flexible programming language
The unfortunate way R is taught…
Some slides on “R as a calculator” (only half joking)
Then straight into plotting histograms and computing t-tests
- Effectively treats computation / data science as black box
. . .
R was first created “by statisticians for statisticians” (1991)
- So this way of teaching R makes sense historically
. . .
But teaching needs change in modern times:
- Our data is larger and more complex than in 1990s
- Reproducibility requires proper programming skills
Challenge of teaching programming
Programming is a skill, not a knowledge to transfer
Teaching R in a lecture format would mean 3 hours of torture
. . .
. . .
A series of problems-solutions to develop understanding of:
- What happens behind the scenes of data-science operations.
- Which will give you tools and confidence to build “mental models”
Still, a couple of practical tips
Knowing RStudio well is like having a superpower
Don’t take it as nothing but a text editor like Notepad.
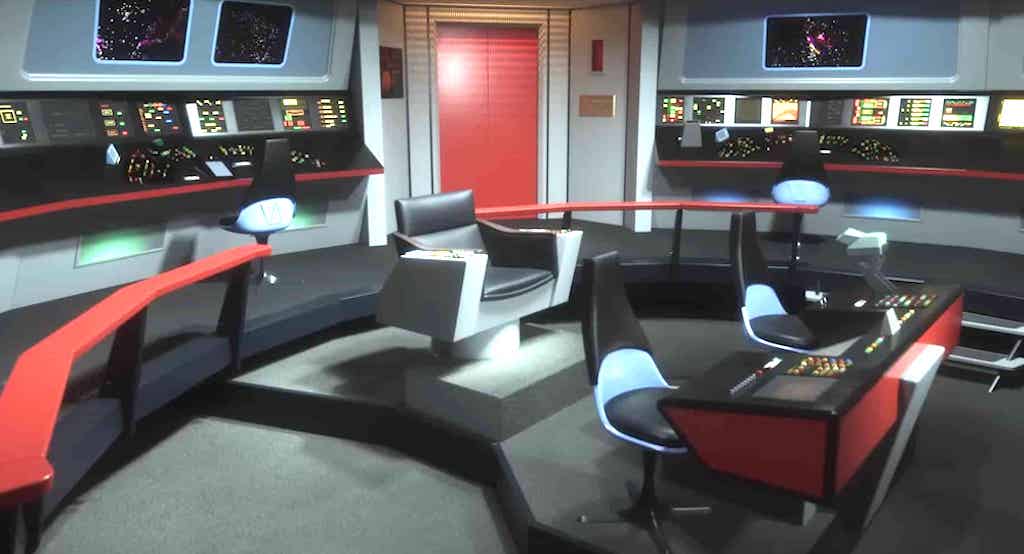
It’s a starship Enterprise of data science at your fingertips. It’s incredible powerful and has a lot of features.
. . .
This cheatsheet has a lot of information, but try to internalize keyboard shortcuts which I highlighted in yellow in the PDF.
At first it will be annoying and slower to use keyboard and not a mouse, but trust me. It will pay of in the long run.
Read-Eval-Print Loop (REPL)
[…] the user enters expressions (rather than an entire [computer program]), the REPL evaluates them and displays the results […] – Wikipedia
An idea from ancient computers (1964!) with these functions:
- read — accepts a bit of code from a user (
1 + 2) - eval — evaluates the code (applies
+on1and2, yielding3) - print — prints the result
6on the screen
Steps 1.-3. repeat in an infinite loop, until the program closes.
. . .
R console is a powerful REPL!
R console is like an ultimate experimental lab equipment
R encourages a highly interactive workflow.
When I don’t understand something, some code I don’t get, etc., I always type it in the REPL to build an intuition.
. . .
Doing data analysis is like playing a detective, especially when figuring out bugs and problems.
. . .
Form a hypothesis, run a tiny bit of R code to test the hypothesis. Move forward based on the result you got.
. . .
I see a lot of experienced PhD students writing and running long code top-to-bottom, instead of thinking methodically.
Built-in R help always has an answer!
All languages (and their packages) have documentation, sure.
But it’s mostly scattered on the internet, often hard to find.
. . .
R packages have a standardized documentation inside R!
- Every
funchas a manual page available at command?func
. . .
Every single such help page describes:
- Basic usage of the function
- Which optional parameters can be given
- Description of what the function does
- Runnable example code (!!!)
These manuals are amazingly helpful
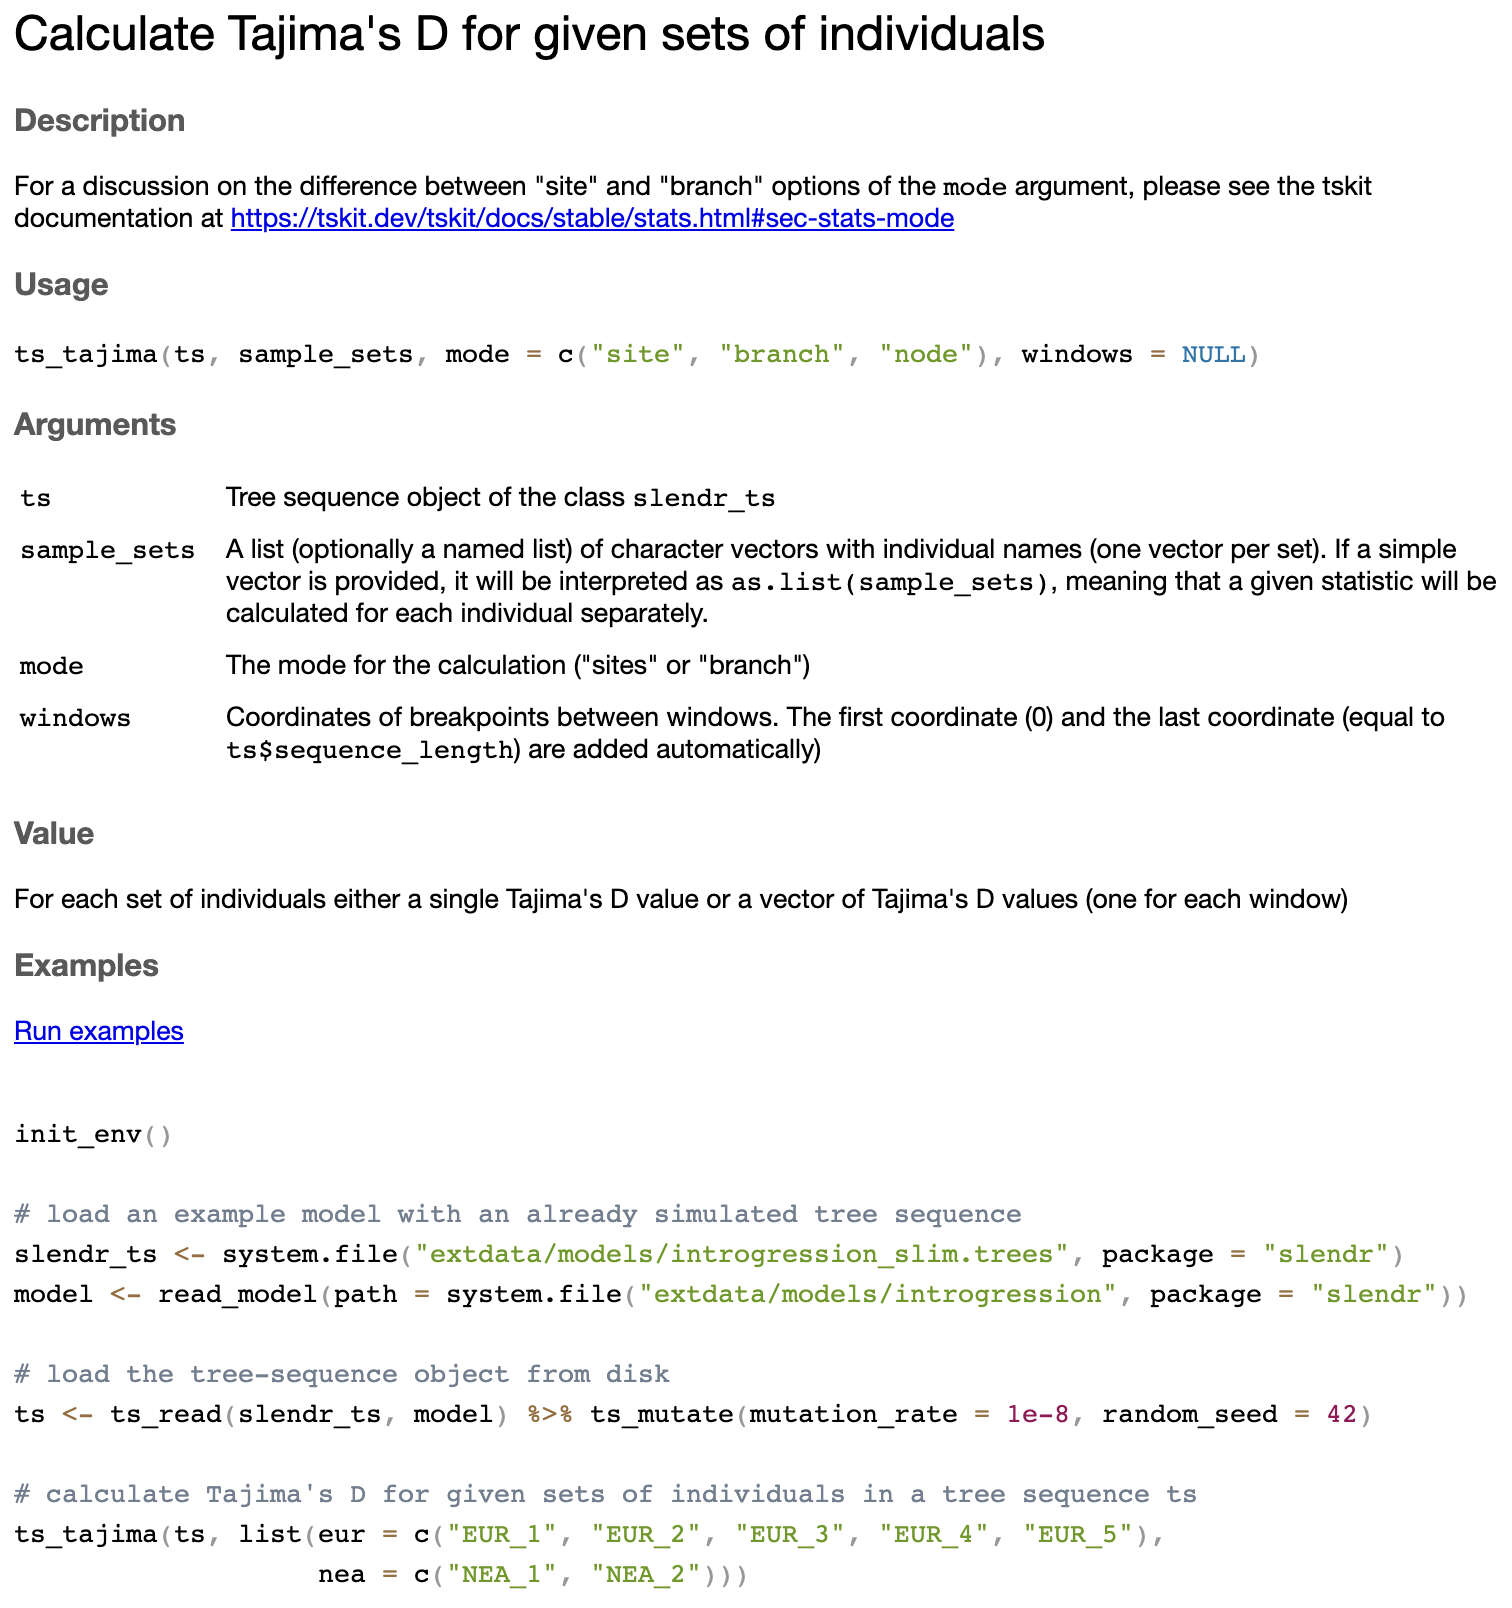
ts_tajima() from my R package.)
Consider switching the pane layout
In the RStudio menu Global Options -> Pane Layout set:
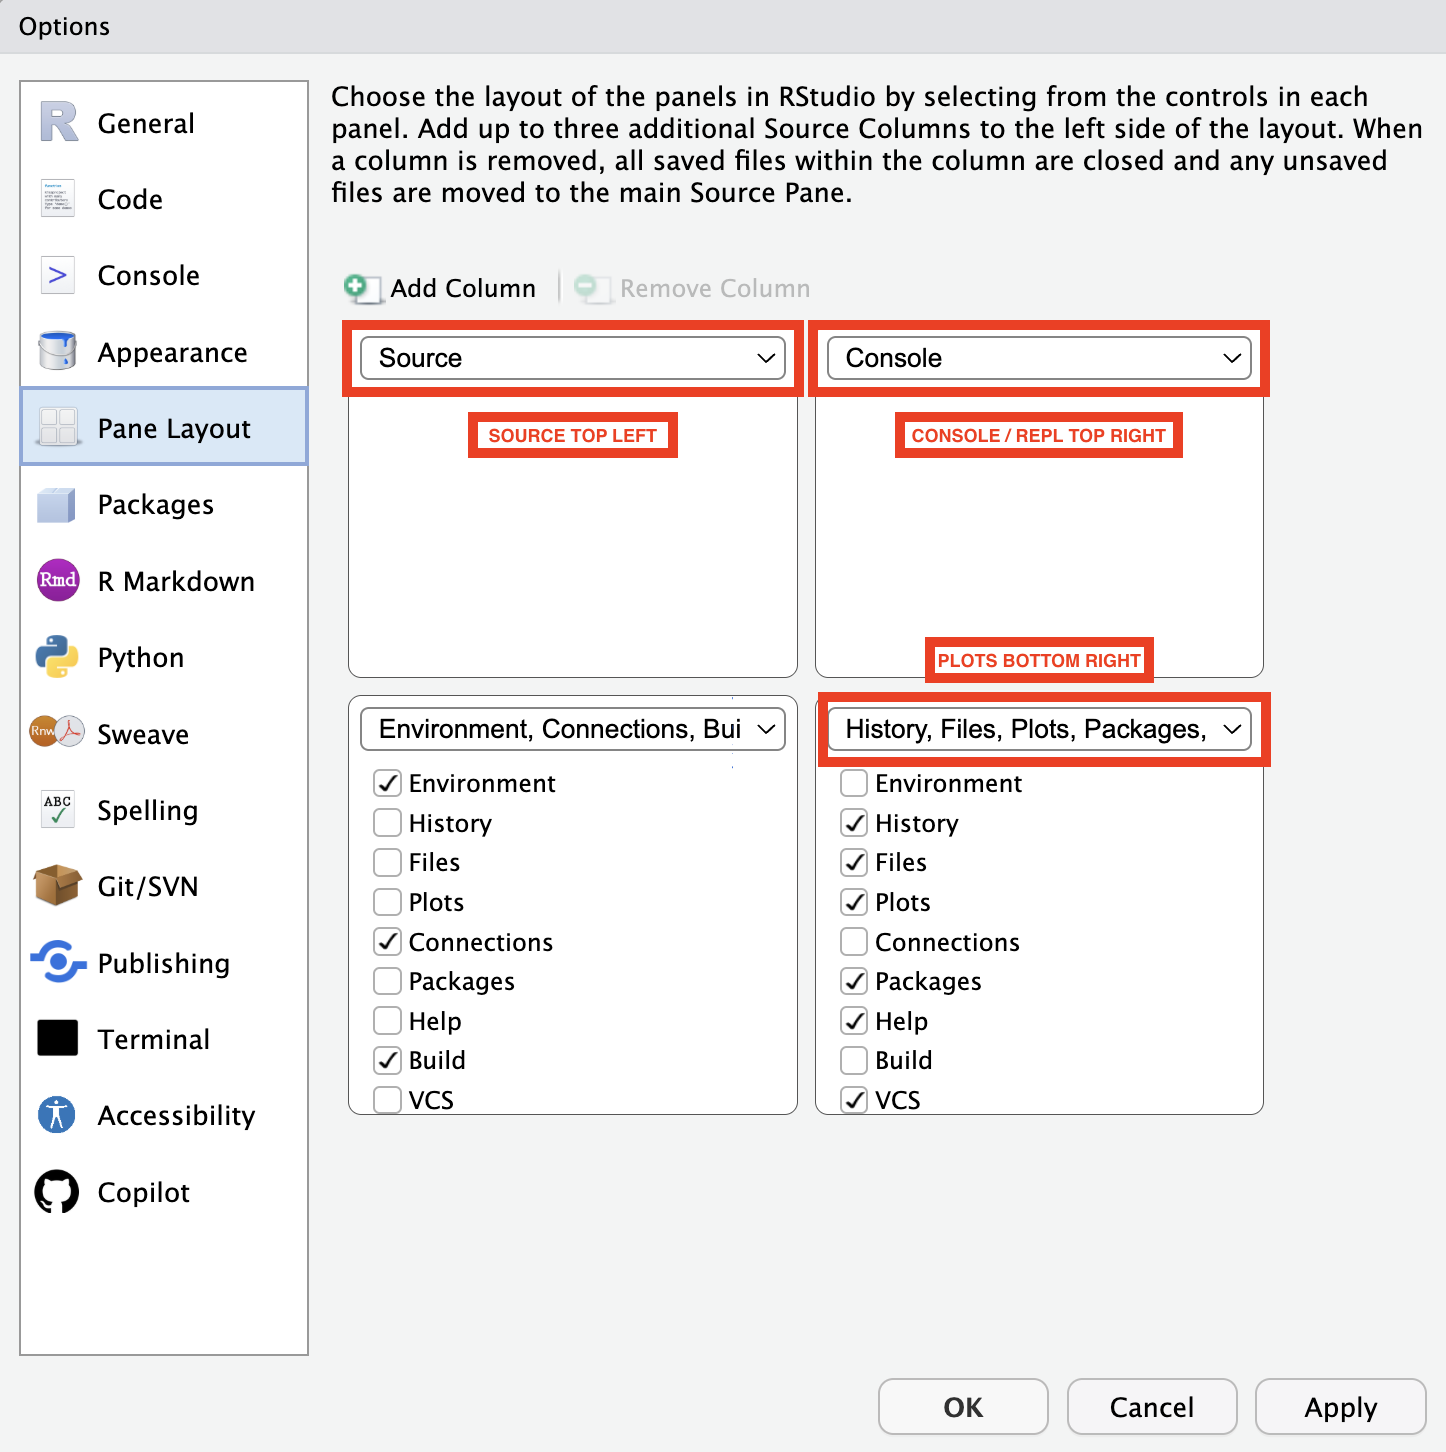
Maximum vertical space for code and easy switching between script and R console (particularly with keyboard shortcuts).
Let’s get started!
- Go to www.bodkan.net/simgen
- Click on “R bootcamp” in the left panel—these are the materials for this session (exercises, solutions, explanations)
- “Cheatsheets and handouts” section in the left panel contains a single-page version of these slides and RStudio and base R cheatsheets for your reference
- Open your RStudio and start working!