p1 <-population("p1", time =4000, N =1000)p2 <-population("p2", time =3000, N =1000, parent = p1)p3 <-population("p3", time =2000, N =1000, parent = p2)p4 <-population("p4", time =1000, N =1000, parent = p3)model <-compile_model(populations =list(p1, p2, p3, p4), generation_time =1)schedule <-schedule_recording(model, times =0, list(p1, 10), list(p2, 10), list(p3, 10), list(p4, 10))
scenarios <-ts_replicate(n =10, { ts <-msprime(model, sequence_length =10e6, recombination_rate =1e-8, schedule = schedule) s <-ts_names(model, split =TRUE, schedule = schedule) s1 <-ts_f4(ts, W = s["p4"], X = s["p3"], Y = s["p2"], Z = s["p1"], mode ="branch") s2 <-ts_f4(ts, W = s["p4"], X = s["p2"], Y = s["p3"], Z = s["p1"], mode ="branch") s3 <-ts_f4(ts, W = s["p4"], X = s["p1"], Y = s["p4"], Z = s["p2"], mode ="branch")bind_rows(s1, s2, s3)})p_model1 <-plot_grid(plot_model(model, schedule = schedule, proportions =TRUE),ggplot(scenarios, aes(paste(W, X, Y, Z), f4)) +geom_boxplot() +geom_jitter() +geom_hline(yintercept =0, linetype ="dashed", color ="red"),nrow =2)
f4 as a measure of gene flow
Branch length overlap as a measure of directionality
Base model
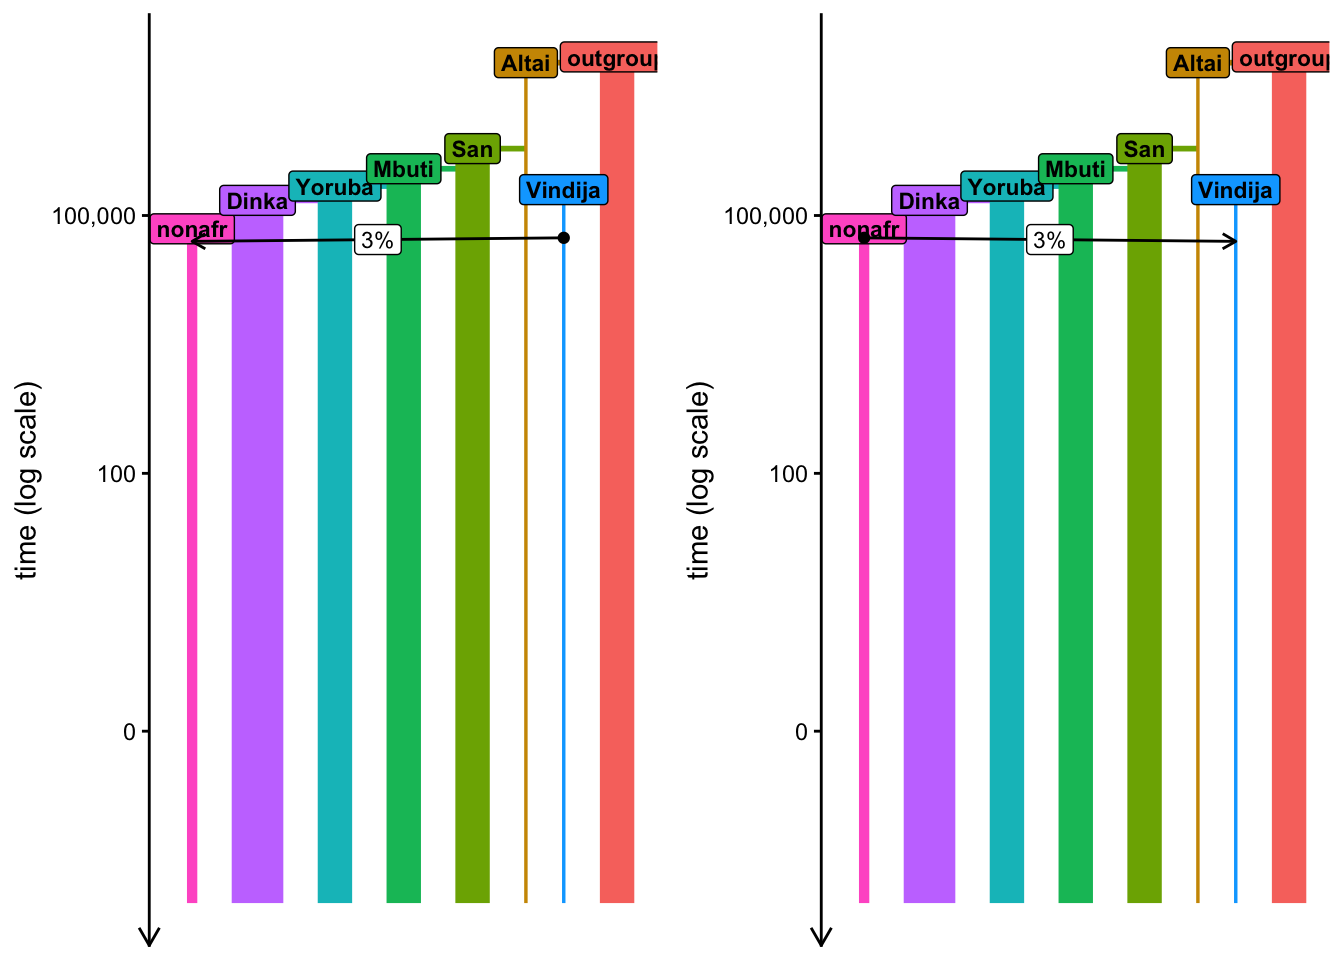
library(dplyr)library(ggplot2)library(cowplot)library(slendr)init_env()outgroup <-population("outgroup", time =7000000, N =10000)altai <-population("Altai", time =6000000, N =1000, parent = outgroup)vindija <-population("Vindija", time =200000, N =1000, parent = altai)san <-population("San", time =600000, N =10000, parent = altai)mbuti <-population("Mbuti", time =350000, N =10000, parent = san)yoruba <-population("Yoruba", time =220000, N =10000, parent = mbuti)dinka <-population("Dinka", time =150000, N =15000, parent = yoruba)nonafr <-population("nonafr", time =70000, N =3000, parent = dinka)
Neanderthal -> MH and MH -> Neanderthal gene-flow models
model1 <-compile_model(populations =list(outgroup, altai, vindija, san, mbuti, yoruba, dinka, nonafr),gene_flow =gene_flow(from = vindija, to = nonafr, proportion =0.03, start =55000, end =50000),generation_time =30)schedule1 <-schedule_recording(model1, times =0, list("each", 5))model2 <-compile_model(populations =list(outgroup, altai, vindija, san, mbuti, yoruba, dinka, nonafr),gene_flow =gene_flow(from = nonafr, to = vindija, proportion =0.03, start =55000, end =50000),generation_time =30)schedule2 <-schedule_recording(model2, times =0, list("each", 5))
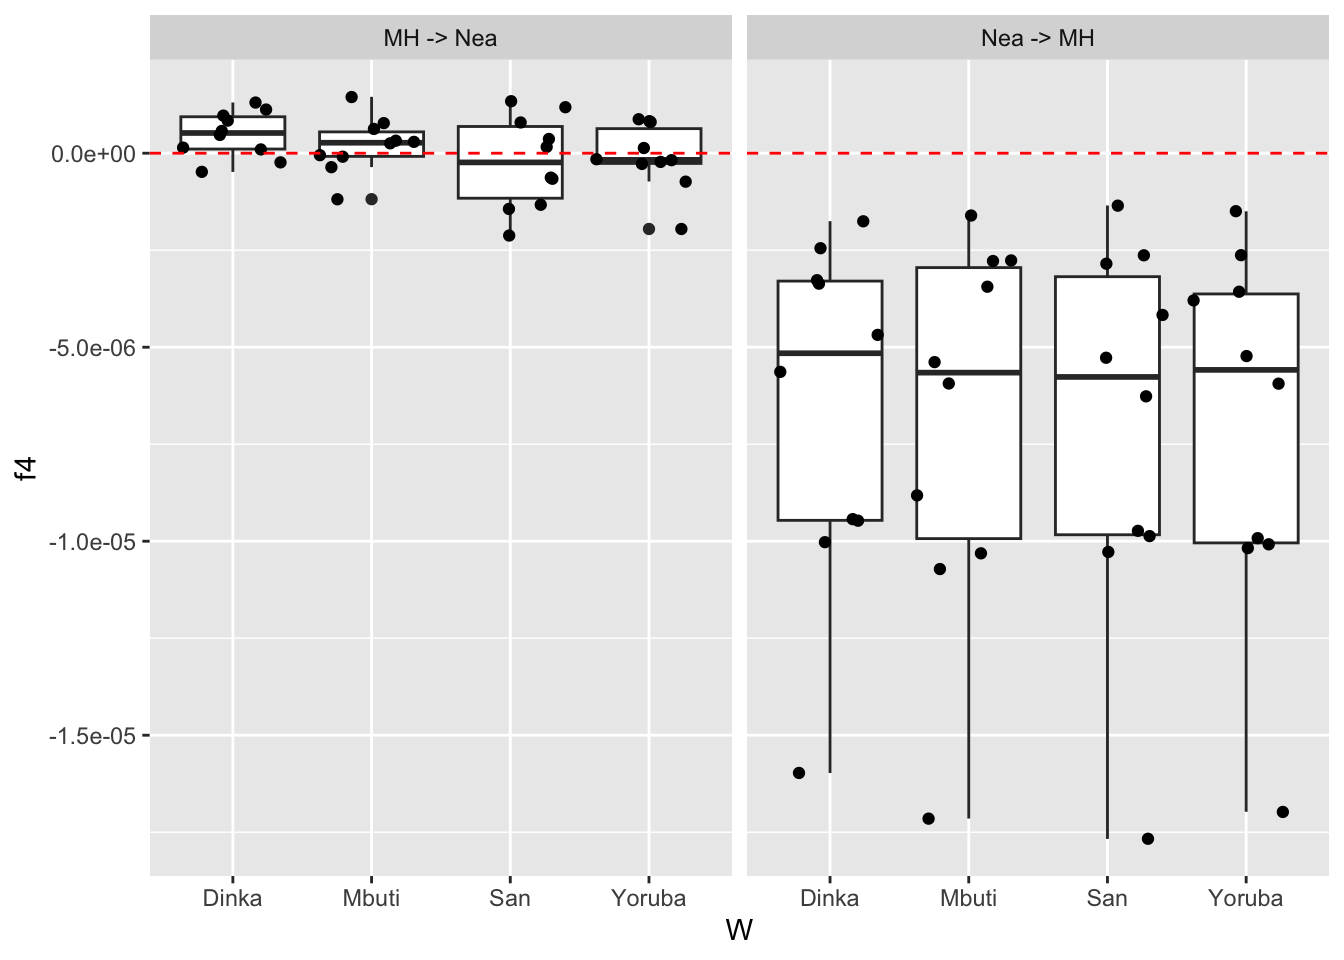
result1 <-ts_replicate(n =10, { ts1 <-msprime(model1, sequence_length =10e6, recombination_rate =1e-8, schedule = schedule1) %>%ts_mutate(1e-8) samples <-ts_names(ts1, split =TRUE)bind_rows(ts_f4(ts1, W = samples["San"], X = samples["nonafr"], Y = samples["Vindija"], Z = samples["outgroup"]),ts_f4(ts1, W = samples["Mbuti"], X = samples["nonafr"], Y = samples["Vindija"], Z = samples["outgroup"]),ts_f4(ts1, W = samples["Yoruba"], X = samples["nonafr"], Y = samples["Vindija"], Z = samples["outgroup"]),ts_f4(ts1, W = samples["Dinka"], X = samples["nonafr"], Y = samples["Vindija"], Z = samples["outgroup"]) ) }) %>%mutate(direction ="Nea -> MH")
result2 <-ts_replicate(n =10, { ts2 <-msprime(model2, sequence_length =10e6, recombination_rate =1e-8, schedule = schedule1) %>%ts_mutate(1e-8) samples <-ts_names(ts2, split =TRUE)bind_rows(ts_f4(ts2, W = samples["San"], X = samples["nonafr"], Y = samples["Vindija"], Z = samples["outgroup"]),ts_f4(ts2, W = samples["Mbuti"], X = samples["nonafr"], Y = samples["Vindija"], Z = samples["outgroup"]),ts_f4(ts2, W = samples["Yoruba"], X = samples["nonafr"], Y = samples["Vindija"], Z = samples["outgroup"]),ts_f4(ts2, W = samples["Dinka"], X = samples["nonafr"], Y = samples["Vindija"], Z = samples["outgroup"]) ) }) %>%mutate(direction ="MH -> Nea")
Exercise 6: Detecting Neanderthal admixture in Europeans
Let’s now pretend its about 2008, we sequenced the first Neanderthal genome, and we are working on a project that will change human evolution research forever. We also have the genomes of a couple of people from Africa and Europe, which we want to use to answer the most burning question of all evolutionary anthropology: “Do some people living today carry Neanderthal ancestry?”
Perhaps you’ve heard earlier about an \(f_4\) statistic (or its equivalent, the \(D\) statistic) which can be used as a test of “treeness”. As a recap, for some “quartet” of individuals or population samples (whose names can be giving as characters such as “EUR_1” to the ts_f4() function, as you can see in the help page of ?ts_f4), they can be used as a hypothesis test of whether the history of those samples is compatible with there not having been an introgression.
Compute the \(f_4\) test of Neanderthal introgression in EUR individuals using the slendr function ts_f4() (make sure to set mode = "branch" argument to minimize stochastic noise).
Note: By default, each slendr / tskit statistic function operates on mutations, and this will switch them to use branch length (as you might know, \(f\)-statistics are mathematically defined using branch lengths in trees and mode = "branch" does exactly that).
Hint: If you haven’t learned this earlier, to solve this exercise, you want to compute and compare the values of these two statistics:
\(f_4\)(<some African>, <a test European>; <Neanderthal>, <Chimp>),
here <individual> can be the name of any individual recorded in your tree sequence, such as names you saw as name column in the table returned by ts_recorded(ts) (i.e. "NEA_1" could be used as a “representative” <Neanderthal> in those equations, similarly for "CHIMP_1" as the fourth sample in the \(f_4\) quarted representing the outgroup).
The first \(f_4\) statistic above is not expected to give values “too different” from 0 (even in case of Neanderthal introgression into Europeans) because we don’t expect two African individuals to differ “significantly” in terms of how much alleles they share with a Neanderthal (because their ancestors never met Neanderthals!). However, the other statistic should be “significantly negative” if there Neanderthal introgression into Europeans happened some time throughout their history.
Is the second of those two statistics “much more negative” than the first, as expected assuming introgression from Neanderthals into Europeans?
Why am I putting “significantly” and “much more negative” in quotes in the previous sentence? What are we missing here for this being a true hypothesis test as you might be accustomed to from computing \(f\)-statistics using a tool such as ADMIXTOOLS? (We hinted at this issue a couple of times earlier.)
NoteClick to see the solution
Compute the difference in the amount of allele sharing between two African individuals and a Neanderthal:
f4_null <-ts_f4(ts, W ="AFR_1", X ="AFR_2", Y ="NEA_1", Z ="CHIMP_1", mode ="branch")f4_null
Compute the difference in the amount of allele sharing between an African individual vs European individual and a Neanderthal:
f4_alt <-ts_f4(ts, W ="AFR_1", X ="EUR_1", Y ="NEA_1", Z ="CHIMP_1", mode ="branch")f4_alt
We can see that the second test resulted in an f4 value about ~20 times more negative than the first test, indicating that a European in our test carries “significantly more” Neanderthal alleles compared to the baseline expectation of no introgression established by the comparison to an African …
abs(f4_alt$f4 / f4_null$f4)
… although this is not a real test of significance because we have no Z-score or standard error which would give us something like a p-value for the hypothesis test, this evaluation of statistical expectations and trends using simulations is extremely useful in research, because it allows us to test our ideas on ground-truth models. With empirical data, we rarely (if ever) know exactly what happened. With simulations, we always know which process generated the data and how that process could have influenced our statistics of interest.
Exercise 7: Detecting Neanderthal admixture in Europeans v2.0
The fact that we don’t get something equivalent to a p-value in these kinds of simulations is generally not a problem, because we’re often interested in establishing a trend of a statistic under various conditions, and understand under which conditions and in which way its expected value behaves in a certain way. If statistical noise is a problem, we work around this by computing a statistic on multiple simulation replicates or even increasing the sample sizes.
Note: To see this in practice, you can check out a paper in which I used this approach quite successfully on a related problem.
On top of that, p-value of something like an \(f\)-statistic (whether it’s significantly different from zero) is also strongly affected by quality of the data, sequencing errors, coverage, etc. (which can certainly be examined using simulations!). However, these are aspects of modeling which are quite orthogonal to the problem of investigating the expectations and trends of statistics given some underlying evolutionary model, which is what we’re after in these exercises.
That said, even in perfect simulated data, what exactly does “significantly different from zero compared to some baseline expectation” mean can be blurred by noise with simple single-individual comparisons that we did above. Let’s increase the sample size a bit to see if a statistical pattern expected in \(f_4\) statistic from our Neanderthal introgression model becomes more apparent.
Compute the first \(f_4\) statistic (the baseline expectation between a pair of Africans) and the second \(f_4\) statistic (comparing an African and a European), but this time on all recorded Africans and all recorded Europeans, respectively. Plot the distributions of those two sets of statistics. This should remove most of the evolutionary stochastic noise and make a statistical trend stand out much more clearly.
Hint: Whenever you need to compute something for many things in sequence, looping is very useful. One way to do compute, say, an \(f_4\) statistic over many individuals is by using this kind of pattern using R’s looping function lapply():
# Loop over vector of individual names (variable x) and apply a given ts_f4()# expression on each individual (note the ts_f4(..., X = x, ...) in the code)X <-c("ind_1", "ind_2", ...)list_f4 <-lapply( X,function(x) ts_f4(ts, W ="AFR_1", X = x, Y ="NEA_1", Z ="CHIMP_1", mode ="branch"))# The above gives us a list of data frames, so we need to bind them all into a# single table for easier interpretation and visualizationdf_f4 <-do.call(rbind, list_f4)
NoteClick to see the solution
This gives us list of vectors of the names of all individuals in each population…
sample_sets <-ts_names(ts, split =TRUE)# ... which we can then access like thissample_sets$AFR # all Africanssample_sets$EUR # all Europeans
Let’s compute the \(f_4\) statistic for all Africans…
f4_afr_list <-lapply( sample_sets$AFR,function(x) ts_f4(ts, W ="AFR_1", X = x, Y ="NEA_1", Z ="CHIMP_1", mode ="branch"))# ... and Europeansf4_eur_list <-lapply( sample_sets$EUR,function(x) ts_f4(ts, W ="AFR_1", X = x, Y ="NEA_1", Z ="CHIMP_1", mode ="branch"))
Bind each list of data frames into a single data frame:
f4_afr <-do.call(rbind, f4_afr_list)f4_eur <-do.call(rbind, f4_eur_list)# add population columns to each of the two results for easier plottingf4_afr$pop <-"AFR"f4_eur$pop <-"EUR"# bind both tables togetherf4_results <-rbind(f4_afr, f4_eur)
We can see that the \(f_4\) statistic test of Neanderthal introgression in Europeans indeed does give a much more negative distribution of values compared to the baseline expectation which compares two Africans to each other.
This is why simulations are so powerful — we establish models which generate data under known population history, and then we can investigate what would be the values of our statistics of interest under those models (and perhaps guess which models are then closest to the hidden truth behind our empirical data).
Exercise: Trajectory of Neanderthal ancestry in Europe over time
There used to be a lot of controversy about the question of whether or not did Neanderthal ancestry proportion in Europeans decline or not over the past 40 thousand years (see Figure 1 in this paper and Figure 2 in this paper).
Your simulated tree sequence contains a time-series of European individuals over time. Use the slendr function ts_f4ratio() to compute (and then plot, if you’re familiar with data visualization in R) the proportion of Neanderthal ancestry in Europe over time, commonly designated alpha in the literature. Use \(f_4\)-ratio statistic of the following form:
ts_f4ratio(ts, X =<vector individual names>, A ="NEA_1", B ="NEA_2", C ="AFR_1", O ="CHIMP_1")
If a Neanderthal introgression happened at 3% tens of thousands of years ago, what would you expect the proportion to be in the present day? Lower? About the same?
NoteClick to see the solution
# Extract table with names and times of sampled Europeans (ancient and present day)eur_inds <-ts_recorded(ts) %>%filter(pop =="EUR")eur_inds# Compute f4-ration statistic (this will take ~30s) -- note that we can provide# a vector of names for the X sample set to the `ts_f4ratio()` functionnea_ancestry <-ts_f4ratio(ts, X = eur_inds$name, A ="NEA_1", B ="NEA_2", C ="AFR_1", O ="CHIMP_1")# Add the age of each sample to the table of proportionsnea_ancestry$time <- eur_inds$timenea_ancestrynea_ancestry %>%ggplot(aes(time, alpha)) +geom_point() +geom_smooth(method ="lm", linetype =2, color ="red", linewidth =0.5) +xlim(40000, 0) +coord_cartesian(ylim =c(0, 0.1)) +labs(x ="time [years ago]", y ="Neanderthal ancestry proportion") +theme_bw() +ggtitle("Neanderthal ancestry proportion in Europeans over time")# For good measure, let's test the significance of the decline using a linear modelsummary(lm(alpha ~ time, data = nea_ancestry))
In conclusion, assuming neutral drift, we don’t expect the Neanderthal trajectory to change, even after tens of thousands of years.
Exercise: How many unique f4 quartets are there?
If you’ve learned about \(f\)-statistics before, you’ve probably seen various symmetries in \(f_4\) (but also other \(f\)-statistics) depending on the arrangement of the “quartet”. As a trivial example, an \(f_3(A; B, C)\) and \(f_3(A; C, B)\) will give you exactly the same value, and the same thing applies even to more complex \(f\)-statistics like \(f_4\).
Use simulations to compute how many unique \(f_4\) values involving a single quartet are there.
Hint: Draw some trees to figure out why could that be true. Also, when computing ts_f4(), set mode = "branch" to avoid the effect of statistical noise due to mutations.
NoteClick to see the solution
# # install a combinatorics R package# install.packages("combinat")library(combinat)# These are the four samples we can create quartet combinations from:quartet <-c("AFR_1", "EUR_1", "NEA_1", "CHIMP_1")# This is how we can generate all permutations:quartets <-permn(quartet)quartets# How many permutations there are in total?# 4! = 4 * 3 * 2 * 1 = 24factorial(4)# We should therefore have 24 different quartet combinations of sampleslength(quartets)# Loop across all quartets, computing the corresponding f4 statistic (we want# to do this using branch lengths, not mutations, as the mutation-based computation# would involve statistical noise)all_f4s <-lapply(quartets, function(q) ts_f4(ts, q[1], q[2], q[3], q[4], mode ="branch"))# Bind the list of f4 results into a single data frame and inspect the resultsall_f4s <-bind_rows(all_f4s) %>%arrange(abs(f4))print(all_f4s, n =Inf)# Narrow down the results to only unique f4 valuesdistinct(all_f4s, f4, .keep_all =TRUE)distinct(all_f4s, abs(f4), .keep_all =TRUE)