Plot prior distributions of model parameters
Usage
plot_prior(
  x,
  param = NULL,
  facets = FALSE,
  file = NULL,
  replicates = 10000,
  geom = ggplot2::geom_density,
  ...
)
Arguments
- x
Either an object of the class
demografr_abc, or a list of prior sampling statements- param
A character vector containing either parameter names to summarize, or a regex-like matches to be used for subsetting. If
NULL(the default), all parameters will be extracted.- facets
Should individual parameters be plotting on a facet each?
- file
Output file for a figure saved via
ggsave- replicates
How many samples to simulate from each prior for plotting?
- geom
Either
ggplot2::geom_histogramorggplot2::geom_density- ...
Optional argument which will be passed to
ggsave
Examples
priors <- list(
Ne_A ~ runif(1000, 3000),
Ne_B ~ runif(100, 1500),
Ne_C ~ runif(5000, 10000),
Ne_D ~ runif(2000, 7000),
T_AB ~ runif(1, 4000),
T_BC ~ runif(3000, 9000),
T_CD ~ runif(5000, 10000),
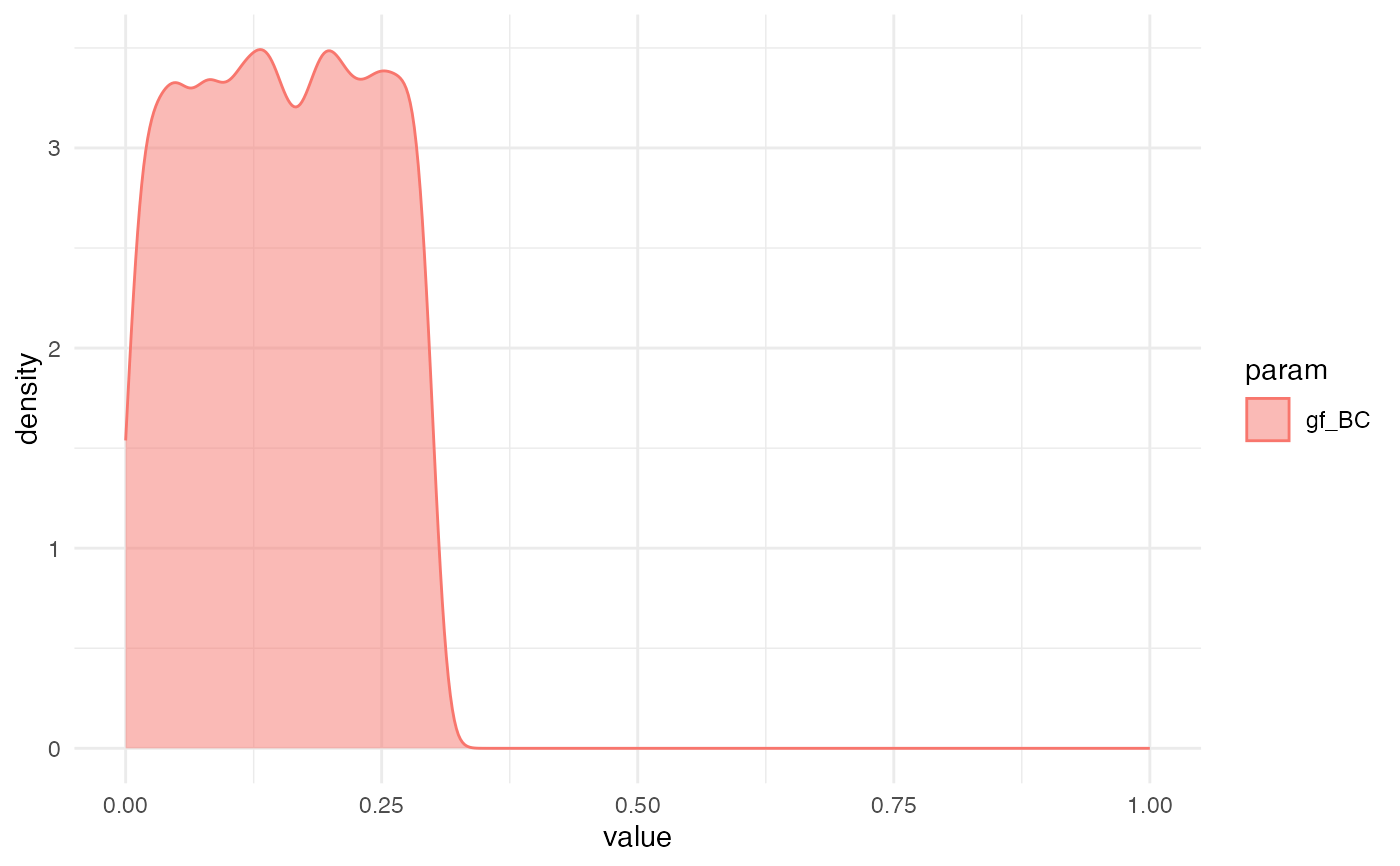
gf_BC ~ runif(0, 0.3)
)
# as with many other distribution plotting functions, plotting everything
# at once doesn't make much sense
# plot_prior(priors)
# it's better to visualize together distributions of the same scale
# plot_prior(priors, "^Ne")
plot_prior(priors, "gf") + ggplot2::xlim(0, 1)