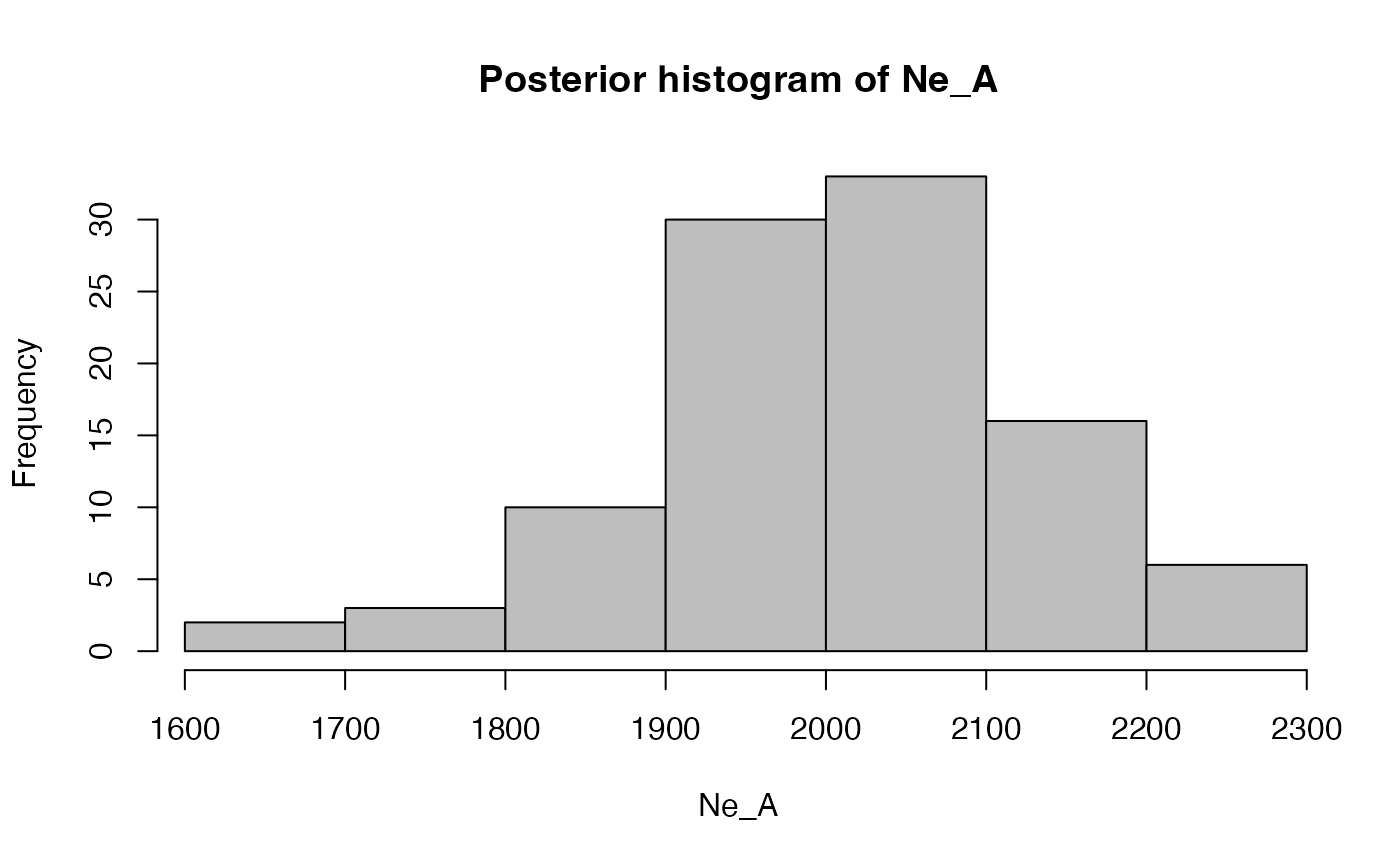
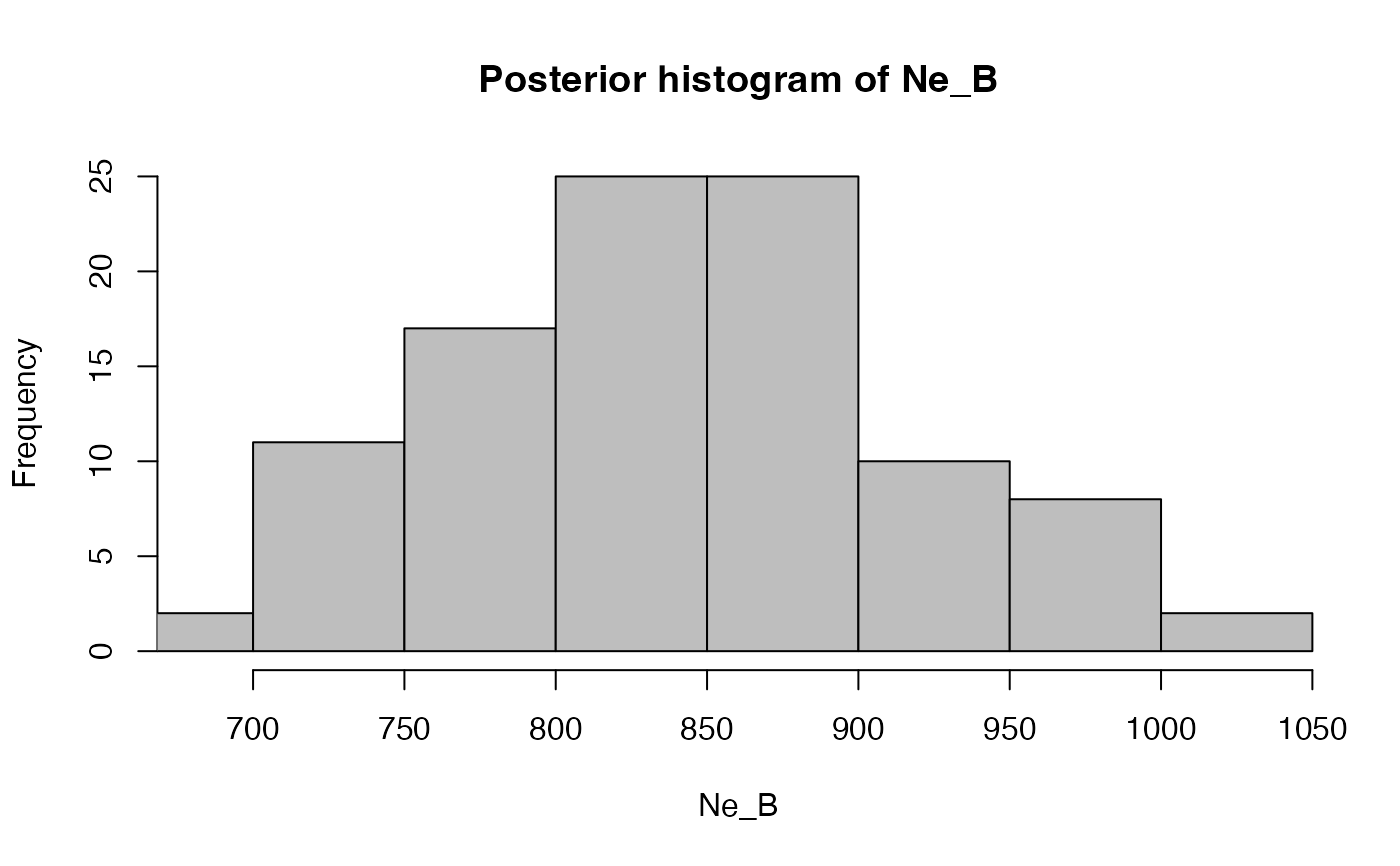
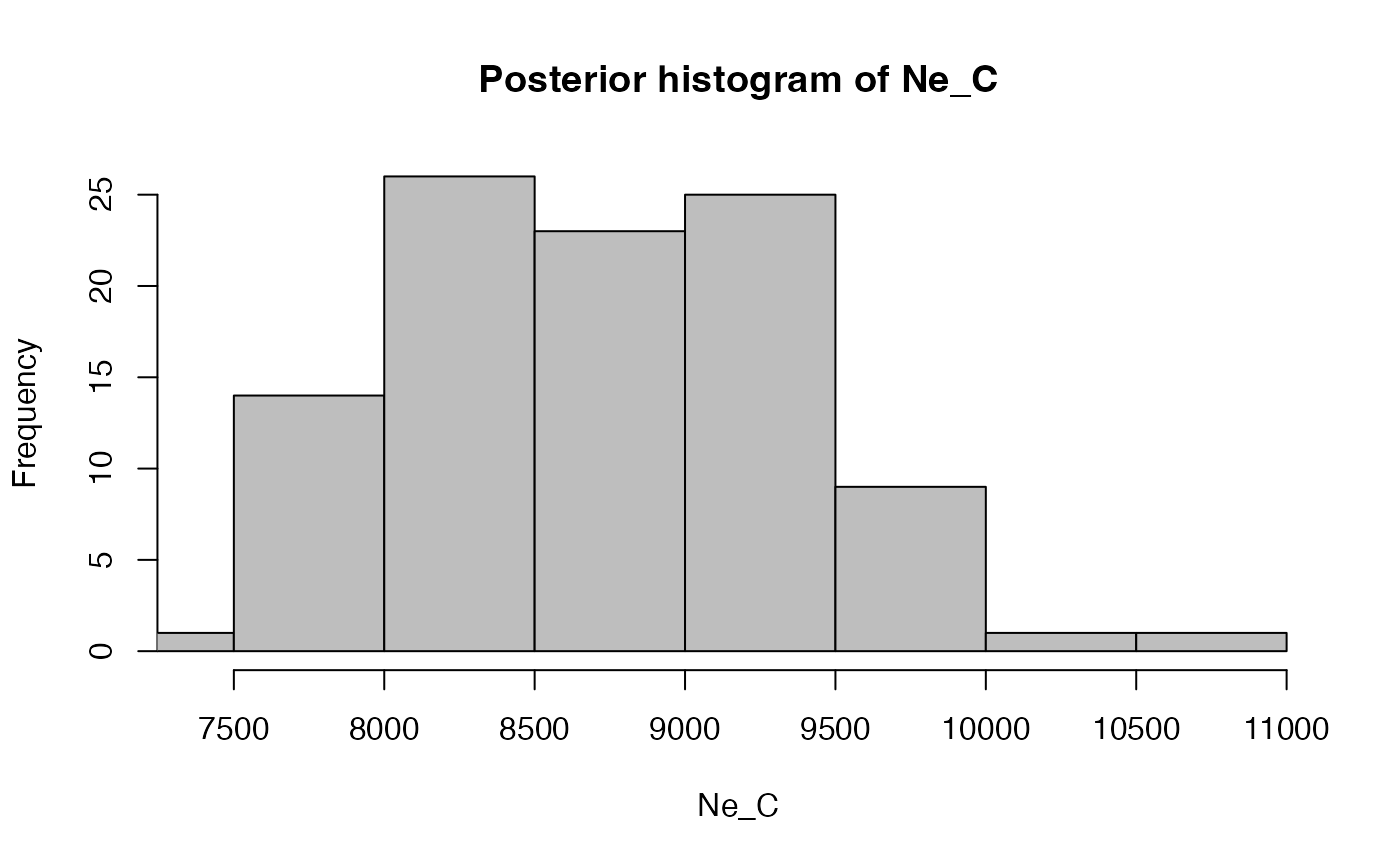
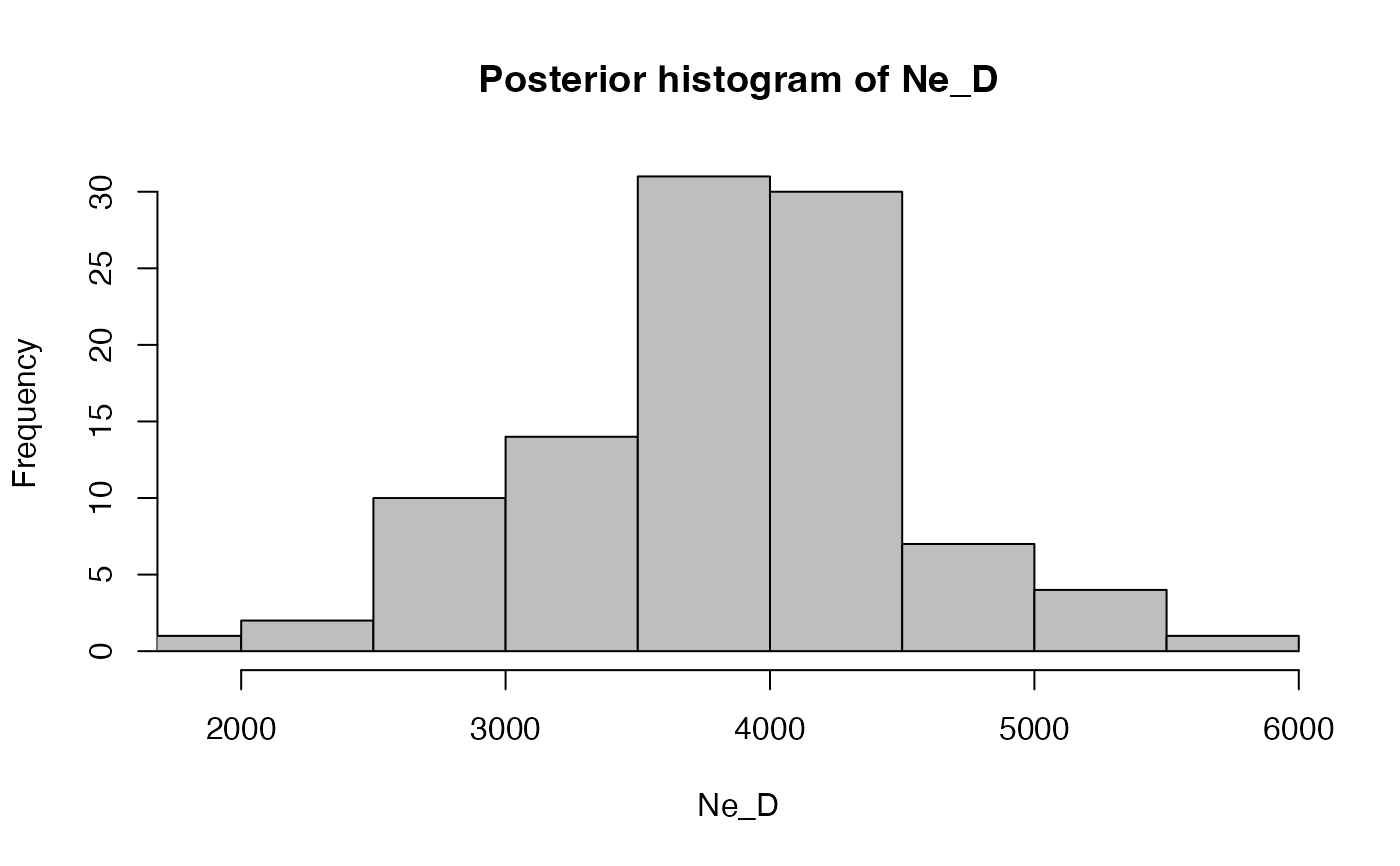
Plot histogram of posterior distributions
Usage
# S3 method for class 'demografr_abc.abc'
hist(x, param = NULL, ...)Examples
# read inferred posterior distribution object from an example ABC run
abc_res <- readRDS(system.file("examples/basics_abc.rds", package = "demografr"))

# plot histograms of posteriors for all parameters (in sequence)
# hist(abc_res)

# plot only selected posteriors
# hist(abc_res, param = "gf_BC")
hist(abc_res, param = "^Ne_")